Forest Growth & Yield Analytics
A full-stack platform that fits, benchmarks, and serves basal-area growth models for 13 species and forest-unit groups, built for scientists at Ontario's Ministry of Natural Resources and Forestry.
- Position
- Software developer, industry partner project; MNRF forestry scientists as clients
- Period
- September 2025 to April 2026; public edition October 2026
- Stack
- Python 3.11
- FastAPI
- SQLAlchemy 2.0
- Alembic
- scikit-learn
- XGBoost
- LightGBM
- statsmodels
- React 19
- TypeScript
- Vite
- PostgreSQL
- SQL Server
- SQLite
- Playwright
- GitHub Actions
- Status
- Delivered to MNRF; public edition runs on synthetic data only
- Repo
- github.com/TirthPatel6104/BA-growth-tool-public
The question
Foresters planning a harvest need to know how much a stand will grow over the next 5 to 25 years. MNRF has decades of plot remeasurements and an established growth equation. Most growth tools stop at applying that equation. This one also asks: is the production equation actually the best model for this data?
The production model
The engine fits the relative growth rate of stand basal area with a fixed-form linear regression:
| Term | Meaning | Units | Expected sign |
|---|---|---|---|
BA | Initial stand basal area | m²/ha | negative |
BA² | Density saturation | (m²/ha)² | |
AGS_frac | Share of acceptable growing stock | 0 to 1 | positive |
TCR | Timber capability rating of the site | 1 to 7 | positive |
DQ | Quadratic mean diameter at breast height | cm | negative |
q | Diameter-distribution quotient | none | positive |
Cut | Partial harvest flag | 0 or 1 | negative |
Projection iterates once a year: BAt+1 = BAt + RGR · BAt. Models are fit for 13 groups (eight species and five forest units). Every fitted coefficient is checked against its expected biological sign, and a fit that gets a sign wrong is flagged before anyone reads a projection from it.
The benchmark
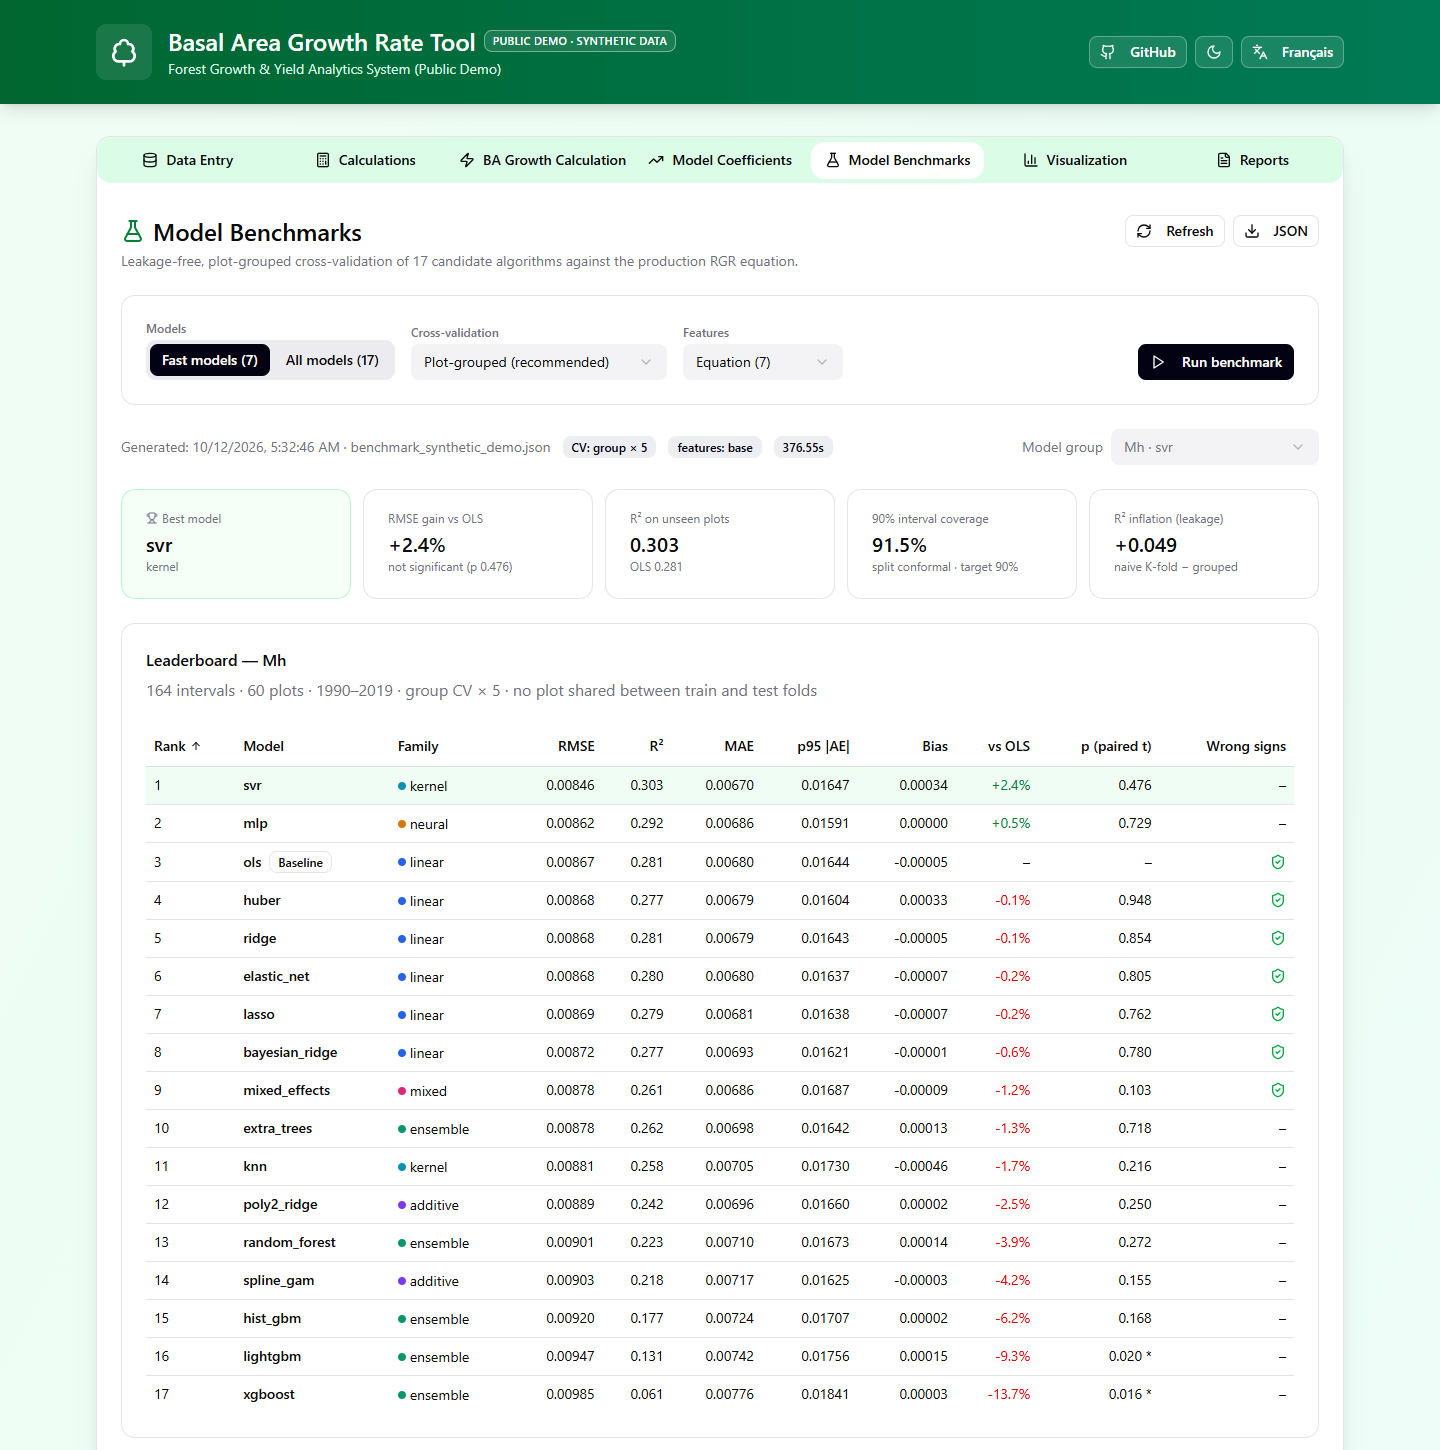
Remeasured plots are the trap. The same plot shows up at several dates, so a random train and test split puts its future in the training set and its past in the test set, and every model looks better than it is.
- 17 algorithms. OLS, ridge, lasso, elastic net, Huber, Bayesian ridge, polynomial ridge, spline GAM, SVR, k-NN, random forest, extra trees, histogram GBM, XGBoost, LightGBM, MLP, and a mixed-effects model.
- Three splits. Plot-grouped cross-validation (no plot on both sides), temporal, and naive k-fold. The naive score is printed next to the grouped one, so the leakage is a number on the page.
- Against the incumbent. Each challenger gets a paired t-test against the production equation. A model that wins by noise does not win.
- Honest intervals. Split-conformal prediction intervals with measured coverage, plus
permutation_importanceper model. - Output. A JSON and Markdown leaderboard across all 13 groups, from the UI, the API, or the command line.
The platform around it
- API. FastAPI with 25 REST endpoints for per-plot predictions, 5 to 25 year projections, coefficients, and benchmark runs. Training and benchmark jobs return
202 Acceptedand a job id, so a long fit never blocks a request. - Data layer. SQLAlchemy 2.0 behind one Alembic migration chain that runs on SQLite, PostgreSQL, and SQL Server.
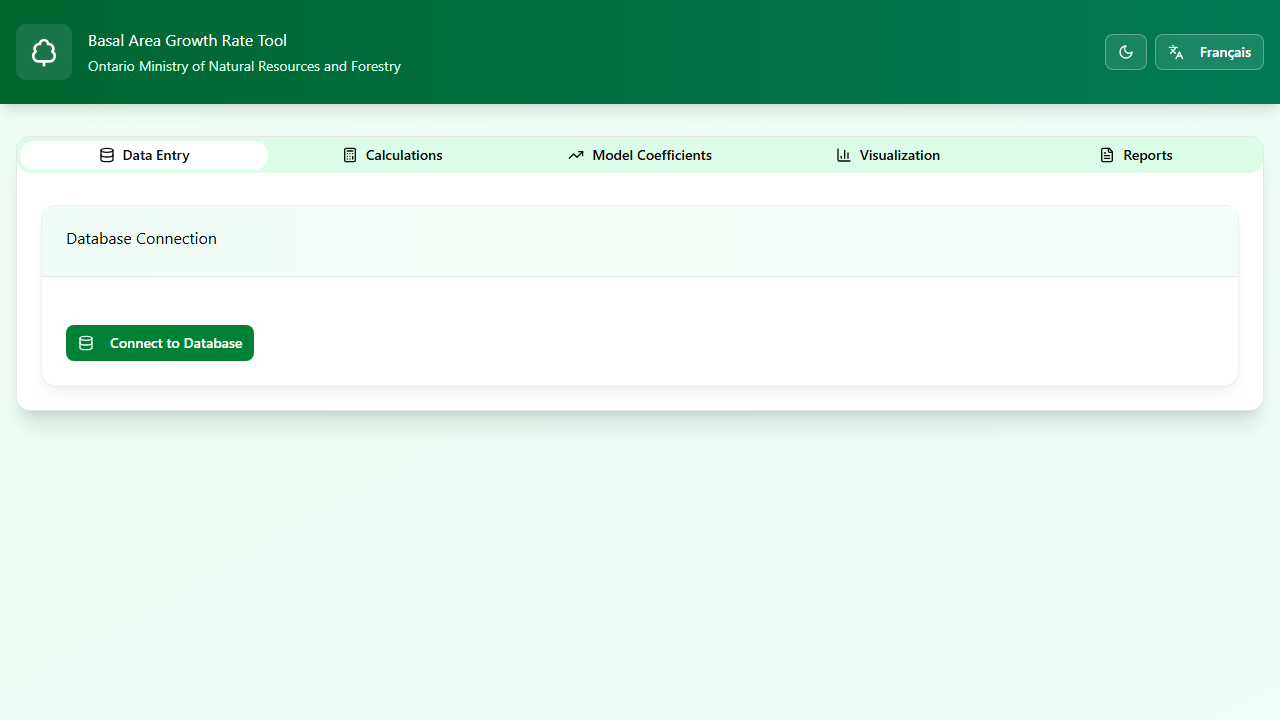
- Front end. React 19 and TypeScript. Bilingual (English and French), light and dark themes, usable at phone width.
- CI gates. 89 pytest tests with coverage, flake8 and mypy, ESLint and a TypeScript build, Playwright end-to-end tests with axe accessibility scans, a migration sanity check, and a benchmark smoke test.
- Docs. C4 system design, benchmarking method, and a security disclosure policy, written for the scientists who keep the system.
What is public
The MNRF data is not. The public edition runs on a dataset generated from a fixed random seed, and its README lists exactly what was removed: real plots, coordinates, fitted coefficients, benchmark results, and the agency’s stored procedures. The contract those procedures have to meet is documented so the code still makes sense without them.